
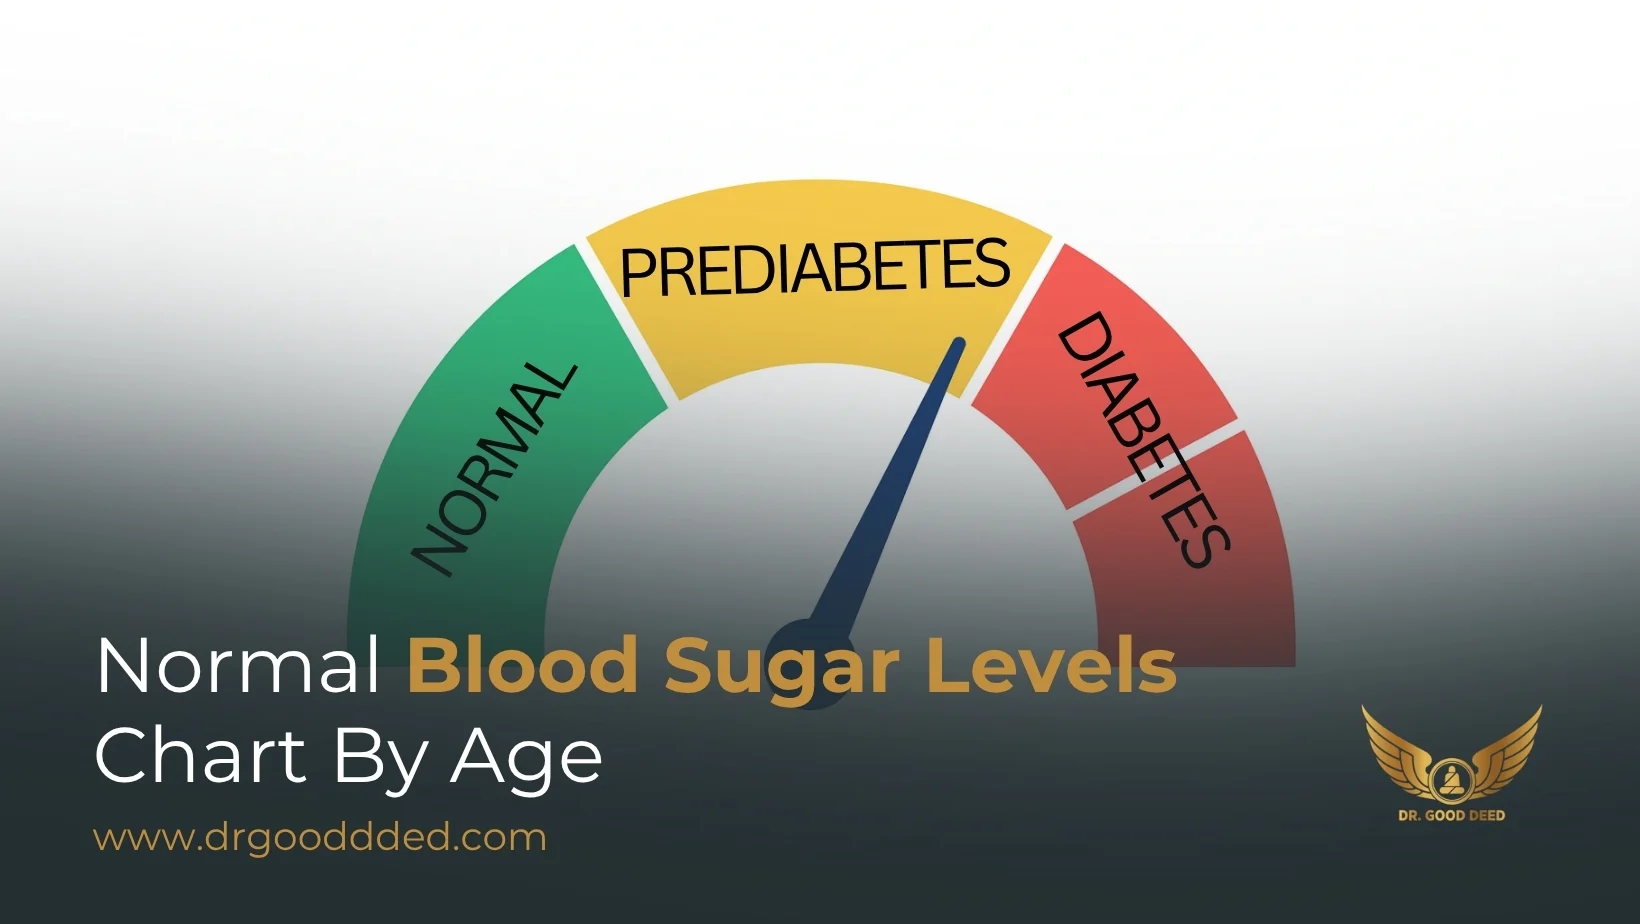
The normal blood sugar levels chart by age shows the safe ranges you should aim for today. It lists fasting numbers, post-meal peaks, and A1C targets. These ranges shift with age, health, and medicines. You can use this guide to spot what is normal for you right now and what needs care soon.
What Are Normal Blood Sugar Levels By Age
Why Blood Sugar Targets Differ By Age
Your body changes with time. Hormones rise and fall. Muscle mass changes. Illness risk changes. That is why targets are not the same for a child, a busy adult, and an older adult.
Doctors set numbers to balance two goals. Avoid lows today. Prevent damage from high temperatures over the years. Leading groups publish cutoffs for fasting, post-meal, and A1C. These include prediabetes and diabetes thresholds that stay the same for all adults.
There is guidance that adjusts goals for children and teens. It aims to protect the brain and growth while keeping readings steady. In older adults, goals aim to reduce falls and hospital visits from lows.
To keep this simple, you can compare your reading to the normal blood sugar levels chart by age on this page. Then talk with your doctor to fine-tune it for your life.
Normal Fasting, Pre-Meal, And Post-Meal Ranges For Adults
For adults without diabetes:
- Fasting 70 to 99 mg/dL is normal.
- Two hours after a meal, under 140 mg/dL is normal.
- A1C under 5.7 percent is normal.
For adults with diabetes, common clinic goals:
- Before meals, 80 to 130 mg/dL works for many.
- Two hours after meals, under 180 mg/dL is a standard goal.
- A1C near 7 percent fits many adults.
These goals come from major medical groups. They also allow personal changes based on your risk of lows and other illnesses.
Use these ranges alongside the normal blood sugar levels chart by age to judge your day-to-day pattern.
How Glucose Levels Change From Childhood To Old Age
In childhood, safety from lows comes first. Teams often set realistic pre-meal targets and use CGM alerts at night. In the teen years, puberty hormones can raise sugar. Sports and growth spurts add swings. Targets are still safe and reachable.
In mid-life, tighter control protects the heart, eyes, kidneys, and nerves. In later life, goals relax a little. The aim is steady days without dangerous dips.
This age curve is one reason the normal blood sugar levels chart by age helps you choose smart goals year by year.
Why Seniors Have Higher Acceptable Glucose Levels
Low sugar can cause a fall, confusion, or a car crash. Many seniors use insulin or drugs that lower their blood sugar. Appetite can be poor during illness. For these reasons, doctors often choose slightly higher targets. The plan still prevents long-term harm while keeping daily life safe. This is standard care, not a shortcut.
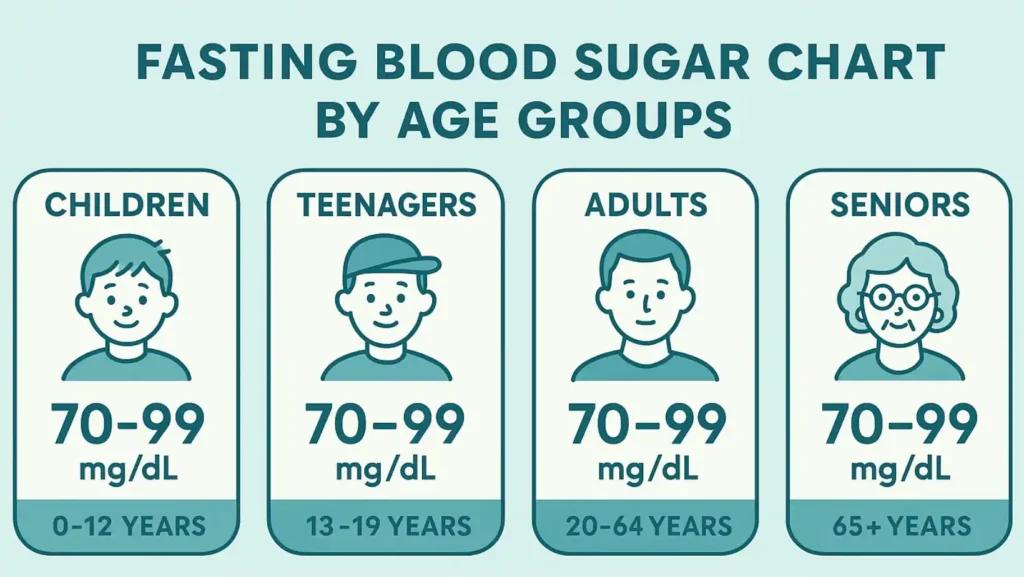
Fasting Blood Sugar Chart By Age Groups
You can check your morning number against these age notes. Always confirm with your doctor if readings stay out of range.
Normal Fasting Blood Sugar For Children 0 to 12 Years
Children without diabetes follow the same lab “normal” fasting zone as adults. That is 70 to 99 mg/dL. Children with diabetes often use safe pre-meal targets close to adult ranges. CGM is common for night alerts and school support. The goal is fewer lows and fewer ER visits, while growth stays on track.
Keep your child’s written range with you. Share it with the school nurse and coaches. Match snacks to play time. This keeps the number close to the normal blood sugar levels chart by age goal for kids.
Fasting Glucose Levels For Teenagers 13 to 19 Years
Puberty increases insulin needs. Teens may wake higher even with good care. Many teams use pre-meal targets near adult numbers and adjust for training, menses, and exams. CGM helps spot silent night highs and lows. Encourage teens to log sleep, meals, and sports. Patterns guide safer changes.
If you are a teen, record your morning number for 2 weeks. Compare it with the normal blood sugar levels chart by age rows. Then review it with your team.
Target Fasting Blood Sugar For Adults 20 to 64 Years
Without diabetes, a fasting under 100 mg/dL is normal. If your fasting sits at 100 to 125 mg/dL on repeat tests, that is prediabetes. Lifestyle steps can bring it down. With diabetes, a pre-meal goal of 80 to 130 mg/dL fits many. Use your meter or CGM to check that mornings settle into this range often.
Tie your reading to your habits. A late high-carb dinner can push the next morning up. A short walk after dinner can pull it down.
Fasting Blood Sugar Range For Seniors 65+ Years
Healthy, active seniors may keep adult targets. If you live with several conditions or take drugs that cause lows, your doctor may ease the plan. Morning goals may sit a little higher to reduce risk. The key is fewer lows, fewer falls, and fewer ambulance trips.
Keep the normal blood sugar levels chart by age on the fridge. Write your own doctor-approved range next to it.
When Fasting Glucose Levels Are Considered High Or Low
- Below 70 mg/dL is low. Treat it right away.
- 70 to 99 mg/dL is normal if you do not have diabetes.
- 100 to 125 mg/dL is prediabetes.
- 126 mg/dL or higher on two days means diabetes.
These cutoffs are clear and do not change with age in adults. If a number looks odd, repeat it on a different morning.
If you cross a cutoff often, compare your pattern with the normal blood sugar levels chart by age. Then plan your next steps with your doctor.
Blood Sugar Targets By Age
Ideal A1C Levels For Children, Adults, And Elderly Individuals
A1C shows your average over about 3 months. Lower is better within safe limits. For many nonpregnant adults with diabetes, an A1C near 7 percent is a solid goal. Kids and teens may use similar goals if they can do it safely with few lows. Older adults with complex health may use higher A1C goals. This reduces the danger from lows without ignoring long-term health.
Track your A1C with the normal blood sugar levels chart by age at hand. It helps you link daily checks with the lab results.
Post-Meal Blood Sugar Goals By Age
Two hours after the first bite:
- Without diabetes, under 140 mg/dL is normal.
- With diabetes, under 180 mg/dL is a standard clinic goal.
- Seniors may use the same or a bit higher if lows are a risk.
If your A1C stays high while pre-meal numbers look fine, you may need to focus on post-meal peaks.
Use a timer. Check exactly two hours after you start eating. Compare the result to the normal blood sugar levels chart by age.
CGM Time-In-Range Targets For Each Age Group
CGM shows your day as minutes in the target range. For many people with diabetes, the goal is at least 70% of the time between 70 and 180 mg/dL. Less than 4% of the time should be under 70 mg/dL. Less than 1% should be under 54 mg/dL. Care teams may allow a lower time-in-range goal for people at high risk of lows. Children and teens use similar ranges with a focus on safety and growth.
Match your CGM report to the normal blood sugar levels chart by age for a quick status check.
Normal Blood Sugar For Seniors

Why Glucose Control Becomes More Flexible With Age
A single low can break a hip or cause a car crash. Appetite can be poor during illness. Memory issues can lead to missed meals or wrong doses. Because of these risks, your doctor may set a safer, slightly higher range. The focus is on daily safety, clear thinking, and steady energy. That approach is backed by formal guidance for older adults.
Keep your targets written down. Store quick sugar at home and in the car. Share your plan with family.
Recommended Fasting And Post-Meal Readings For Older Adults
Ask your doctor for personal ranges. Many older adults keep pre-meal numbers near the adult targets. Some may use a higher upper bound if they have a history of lows, kidney disease, or many medicines. Post-meal peaks should settle within a few hours. Use two-hour checks to confirm. This aligns with the normal blood sugar levels chart by age while guarding against lows.
A simple routine helps:
- Eat at steady times.
- Include protein and fiber at each meal.
- Take a 10 to 15-minute walk after meals if you can.
How To Prevent Hypoglycemia In Elderly Patients
Lows are dangerous. You can cut the risk with a few habits:
- Never skip meals when you take insulin or sulfonylureas.
- Keep glucose tablets or a small juice within reach.
- Check before driving.
- Review all medicines with your doctor. Some raise the chance of a low.
- Use CGM alerts if you qualify. They warn you before a crash.
These steps save lives and match the goals set for older adults.
What Is Normal Blood Sugar For Your Age
You judge your numbers by timing, pattern, and health. Fasting means no calories for 8 hours. Two hours after the first bite shows post-meal control. If you do not take glucose-lowering drugs, standard cutoffs apply across adult life. If you use insulin or pills that can cause lows, your plan may shift.
Use your meter with a simple routine:
- Check fasting on three different mornings.
- Check two hours after two different meals in a week.
- Write the numbers with food notes.
Now compare those notes to the blood sugar cutoffs you have and your doctor set. Keep the normal blood sugar levels chart by age on your phone. It turns confusing points into a clear next step. When you stay near your written range most days, you are on track with the normal blood sugar levels chart by age plan.
Factors That Affect Blood Sugar By Age
Hormonal Changes
Puberty, monthly cycles, pregnancy, and menopause can raise or swing sugars. Growth hormone and sex hormones often push numbers up. Aging can reduce kidney function and change how drugs work. Log timing of symptoms so you can match changes to the normal blood sugar levels chart by age you follow.
Physical Activity And Metabolism Differences
Kids and teens often burn more sugar with play and sports. Many adults sit more at work. Seniors may lose muscle. Muscle uses glucose. Small daily walks help at every stage. Ten minutes after each meal can lower your next reading. Strength work twice a week protects muscle and helps you meet the normal blood sugar levels chart by age goals.
Common Health Conditions That Raise Blood Sugar With Age
- Sleep apnea, thyroid issues, and infections can raise sugars.
- Some steroids and mental health meds raise sugars.
- Pain and stress hormones raise sugars.
- Dehydration raises sugars.
Tell your care team about every new drug. Ask how to adjust to stay within your normal blood sugar levels chart by age range.
How To Maintain Normal Blood Sugar At Any Age
Diet And Nutrition Tips For Stable Glucose Levels
Build plates that keep you full and steady:
- Fill half the plate with non-starchy vegetables.
- Use lean protein at each meal for steady energy.
- Pick whole grains most of the time.
- Keep sugary drinks for rare moments.
- Eat fruit with a meal, not alone, if you spike after fruit.
Try this plate at dinner, then walk for 10 minutes. Check two hours later. Compare the result with your normal blood sugar levels chart by age target. Repeat the same plan tomorrow.
Exercise And Activity Recommendations For Each Age Group
- Children and teens: aim for at least 60 minutes of movement daily.
- Adults: aim for 150 minutes a week of brisk movement.
- Seniors: add balance drills and light strength work.
If you treat with insulin or a sulfonylurea, check before and after hard activity. Pack a quick carb. Match your activity plan to the fasting blood sugar age groups chart for guidance from your clinic.
Role Of Hydration, Stress Management, And Sleep
Drink water throughout the day. Poor sleep can push fasting up. Short breathing drills lower stress hormones. A cool, dark room helps you fall asleep. Track sleep next to numbers. You will see links you can fix without new pills. That habit keeps you closer to the normal blood sugar levels chart by age line.
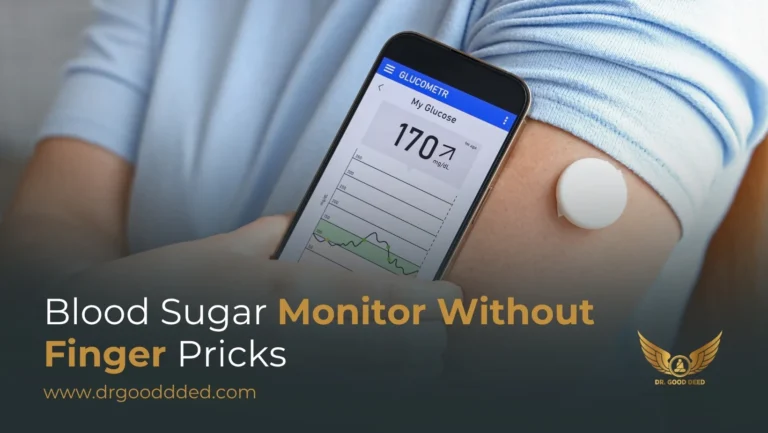
Monitoring Blood Sugar At Home
Meters help you spot trends. CGM gives time-in-range and alerts. Calibrate when your device asks for it. Wash hands before checks. Replace old strips. If numbers look odd, repeat. Store your written target next to your device. This keeps the normal blood sugar levels chart by age front and center.
Understanding Blood Sugar Readings: Fasting Vs Post-Meal
What Your Fasting Glucose Level Reveals
Fasting shows your overnight baseline. A high fasting can point to liver glucose release or late eating. If fasting sits at 100 to 125 mg/dL on repeat tests, that is prediabetes. Above 126 mg/dL on two mornings meets the diabetes bar. Mark those mornings and compare to the normal blood sugar levels chart by age to decide the next step.
What Your 2-Hour Post-Meal Glucose Shows
Post-meal checks show how your body handles carbs at a real table. If you do not have diabetes, under 140 mg/dL at two hours is normal. If you have diabetes, many plans use under 180 mg/dL.
If your A1C stays high while fasting looks fine, your post-meal spikes may be the driver. Adjust portion size, fiber, and timing so your points match the normal blood sugar levels chart by age row you follow.
When To Test And How Often To Track
You test for a reason, not for noise. If you are on insulin, check before meals and at bedtime. If you use a CGM, review time-in-range each week. If you are not on glucose-lowering drugs, you can rely on periodic lab work and targeted checks during changes in weight, meds, or illness.
Link every test to a choice you can make. Then measure again. That loop makes the normal blood sugar levels chart by age useful.
Age-Wise Normal Glucose Levels Chart
When a table helps, keep it short and practical. These are common targets that many clinics use. Your doctor may change them for safety.
| Group | Fasting Goal | 2-Hour After Meal | A1C Aim |
| Children without diabetes | 70 to 99 mg/dL | Under 140 mg/dL | Below 5.7 percent |
| Children with diabetes | Often 80 to 130 mg/dL | Custom, often under 180 mg/dL | Near 7 percent if safe |
| Adults without diabetes | 70 to 99 mg/dL | Under 140 mg/dL | Below 5.7 percent |
| Adults with diabetes | 80 to 130 mg/dL | Under 180 mg/dL | Near 7 percent for many |
| Older adults with complex health | Individualized | Individualized, avoid lows | Higher than mid-life if safer |
Use this table with your normal blood sugar levels chart by age notes. It is a quick view of age-wise normal glucose levels that you can show during a visit. If your pattern sits outside the table, you have a clear reason to ask for changes that fit you.
When To See A Doctor About Abnormal Blood Sugar
Signs Your Glucose Is Too High Or Too Low For Your Age
Call your doctor if you see these patterns:
- Lows under 70 mg/dL more than once a week.
- Highs over 250 mg/dL that last more than a few hours.
- Sudden blurry vision, heavy thirst, or fast weight loss.
- Confusion or fainting.
Bring your log. Ask for blood sugar targets by age that match your medicines and risks. Match new targets to the normal blood sugar levels chart by age that you keep.
When To Repeat Testing Or Get An A1C Check
Repeat any odd result on a new day. If two fasting tests are high, schedule a visit soon. If your A1C sits in the prediabetes zone, retest in a few months and start lifestyle steps now. If you change a major medicine, check more often for one to two weeks. Use those checks to line up with the normal blood sugar levels chart by age range you want.
Medical Conditions That May Alter Your Glucose Targets
Kidney disease, heart disease, liver disease, cancer care, and dementia increase risk. Steroids for asthma or arthritis can raise sugars. Your team will set a safer plan. Keep it in writing. Tape it near your meter so you do not drift from your normal blood sugar levels chart by age goals.
FAQ
What Is A Normal Fasting Blood Sugar For A 60-Year-Old?
If you do not have diabetes, 70 to 99 mg/dL is normal. If you have diabetes, many set 80 to 130 mg/dL before meals. Ask for a plan that fits the normal blood sugar levels chart by age.
How Do Normal Glucose Levels Change During Childhood?
The lab fasting range stays the same, yet treatment aims to protect the brain and growth. Teams often use CGM alerts at night. Your family can use the normal blood sugar levels chart by age to guide daily choices.
What’s A Safe Post-Meal Glucose For Seniors?
Under 140 mg/dL is normal without diabetes. With diabetes, many use under 180 mg/dL. Your doctor may allow higher doses to prevent lows. That still follows normal blood sugar for seniors advice within the normal blood sugar levels chart by age.
Is Fasting Sugar Of 110 mg/dL Normal For My Age?
A fasting of 110 mg/dL is prediabetes in any adult. Age does not change that lab cutoff. Start food, sleep, and walking steps. Compare progress with the normal blood sugar levels chart by age each week.
How Often Should I Test My Blood Sugar If I’m Healthy?
If you have no diabetes and no symptoms, you do not need daily checks. Ask for screening during routine visits. Use the normal blood sugar levels chart by age only when your doctor suggests home checks for a short time.
What’s The Ideal A1C For People Above 70?
There is no single number for all. Many use a higher goal than younger adults to reduce lows. Ask for a written plan. Keep it next to your normal blood sugar levels chart by age.
Can Stress Or Poor Sleep Raise My Blood Sugar Temporarily?
Yes. Stress hormones push sugar up. Poor sleep can raise fasting. Fix sleep, add short walks, and try simple breathing drills. Track your change against the normal blood sugar levels chart by age so you see proof.
How Can I Lower Fasting Glucose Naturally At Any Age?
Move daily, add fiber, spread protein, sleep well, and drink water. A short walk after dinner helps. Check again next week. Match the new number to the normal blood sugar levels chart by age you follow.
What Should I Eat To Maintain Healthy Glucose Levels By Age?
Choose vegetables, lean protein, and whole grains most of the time. Add fruit with meals. Limit sugary drinks. These habits help you hit targets in the normal blood sugar levels chart by age and keep energy steady.
Are Normal Blood Sugar Ranges Different For Men And Women?
Lab cutoffs are similar. Pregnancy uses tighter targets. Follow your obstetric plan. After pregnancy, return to standard cutoffs. Use the normal blood sugar levels chart by age to keep your daily checks on track.
How Accurate Are Home Glucose Monitors For Seniors?
Most cleared meters work well when used correctly. Wash your hands and use fresh strips. Avoid extreme heat or cold. CGM adds alerts. Check your meter against clinic labs and your normal blood sugar levels chart by age target.
Can Dehydration Or Illness Affect Test Results?
Yes. Illness, fever, or dehydration can raise sugar. Some drugs do the same. Sip fluids. Call your doctor if numbers stay high. Compare each day to the normal blood sugar levels chart by age you use.
Is It Normal For Blood Sugar To Increase Slightly After Meals?
Yes. A small rise is normal. Without diabetes, most readings drop under 140 mg/dL by two hours. With diabetes, many aim for under 180 mg/dL. Track your peak in the normal blood sugar levels chart by age notes.
What Blood Sugar Level Is Considered Prediabetes By Age?
Prediabetes cutoffs do not change by age in adults. Fasting 100 to 125 mg/dL or A1C 5.7 to 6.4 percent fits. Write these limits near your normal blood sugar levels chart by age so you can act early.


Leave a Comment